Binomial Distribution in Python
Submitted by moazkhan on Saturday, June 27, 2020 - 11:00.
In this tutorial you will learn:
- What is a Binomial Distribution?
- Binomial Distribution Implementation in python
- Visualization of Binomial Distribution
Binomial Distribution
If the experiment can only have two outcomes in a certain situation with certain conditions and limitations, and we perform it multiple times, then the results obtained will produce a binomial distribution. For example, if we toss a coin, there can be only two possibilities, either the result will be head or it will be tail. Two variables determine the results of a binomial distribution, first variable is “n” and it stands for the number of experiments/ repetitions we carry out, while the second variable is “p” which represents the probability of one specific outcome. Binomial distribution must meet three conditions. 1. The number of experiments are fixed 2. Each trial or observation is independent of the other trials 3. Probability of each outcome is sameBinomial Distribution in Python
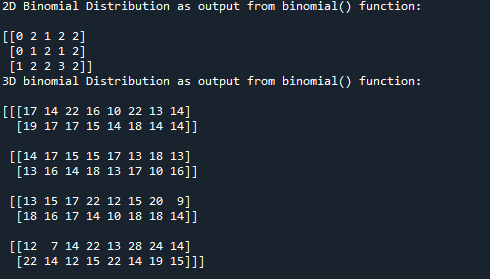
Binomial distribution in python is implemented using binomial() function. The binomial() function is part of random module. It takes in the “size” of the distribution which we want as an output as a first parameter. It takes “n” as a second parameter, “n” is number of times experiment will be carried. It take “p” as a third parameter, the “p” determines the probability of each outcome. All three arguments/ parameters are mandatory for binomial() function. In this example we will generate a 2D array of binomial distribution having size (3,5), in the first line of code we are importing random module from numpy library and in third line we are defining repetitions(n) as 3 times and probability of occurrence as 0.5. You can observe that this example depicts the example of coin being tossed 3 times.- from numpy import random
- #here we are using binomial function to generate binomial distribution of size 3 x 5
- res = random.binomial(size=(3,5), n=3, p=0.5)
- print('2D Binomial Distribution as output from binomial() function:\n')
- #printing the result
- print(res)
- from numpy import random
- #here we are using binomial function to generate binomial distribution of size 4 x 2 x 8
- res = random.binomial (size=(4,2,8), n=80, p=0.2)
- print('3D binomial Distribution as output from binomial() function:\n')
- #printing the result
- print(res)
Visualization of Binomial Distribution
We will visualize the Binomial Distribution using an example. We will visualize the array being generated by the binomial() function with output array size 2000, number of experiments are 10 while probability of each outcome is 0.1 . Here we will use the distplot() to plot the graph.- #importing all the required modules and packages
- from numpy import random
- import matplotlib.pyplot as mpl
- import seaborn as sb
- #here we are using binomial function to generate binomial distribution of size 100
- sb.distplot(random.binomial(size=1000, n = 10, p = 0.1), hist=True, kde=False)
- #plotting the graph
- mpl.show()