Rectangular Distribution in Python
Submitted by moazkhan on Monday, June 29, 2020 - 21:09.
In this tutorial you will learn:
- What is a Rectangular Distribution?
- Rectangular Distribution Implementation in python
- Visualization of Rectangular Distribution
Rectangular Distribution
Rectangular distribution is a distribution that has a constant probability, it is also known as uniform distribution. It is a family of symmetric probability distributions and the outputs of the distribution lies between certain bounds. These bounds are defined by two parameters which are the maximum and minimum values. The difference between the bounds defines the interval length, all intervals of the same length on the distribution's support are equally probable.Rectangular Distribution in Python
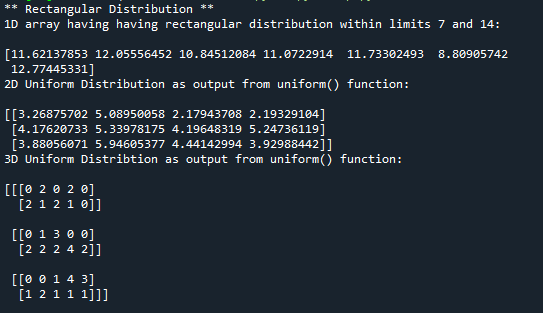
Rectangular distribution in python is implemented using uniform() function. The rectangular() function takes in three parameters. First parameter “size” is the mandatory parameter and it is size of the output array which could be multi dimensional. The second parameter “a” is the lower bound, and if not explicitly defined, its value is taken as 0. The third parameter “b” is the upper parameter and if not explicitly defined, its value is taken as 1. Lets take an example, we will generate an 1D array(1,7) of rectangular distribution having the 7 as lower limit(a) and 14 as upper limit(b). Here you can observe that if we re run the program again and again, the values of the distribution will keep on changing.- #importing the random module
- from numpy import random
- #applying the uniform function with lower limit 7 and upper limit 14
- res_arr= random.uniform(low=7, high=14, size=7)
- #printing the results
- print('1D array having Rectangular Distribution within limits 7 and 14:/n')
- print(res_arr)
- #importing the random module
- from numpy import random
- #here we are using uniform function to generate rectangular distribution of size 3 x 4 with lower limit 2 and upper limit 6
- res_arr = random.uniform(low = 2, high=6, size=(3,4))
- print('2D Rectangular Distribution as output from uniform() function:\n')
- #printing the result
- print(res_arr)
- #importing the random module
- from numpy import random
- #here we are using uniform function to generate uniform distribution of size 3 x 2 x 5
- res = random.uniform(size=(3,2,5))
- print('3D Rectangular Distribution as output from uniform() function:\n')
- #printing the result
- print(res)
Visualization of Rectangular Distribution
In this example, for our better understanding of rectangular distribution itself and the syntax, we will plot rectangular distribution on a graph. Here we will again use distplot() function for graph plot. The upper and lower limit will be 4 and 8 respectively, and the total of 50 values will be used for this plot. Here you can observe that the plot of graph is rectangular shaped, this is the reason behind the uniform distribution being called as rectangular distribution.- #importing all the required modules and packages
- from numpy import random
- import matplotlib.pyplot as mpl
- import seaborn as sb
- #here we are using Uniform function to generate Rectangular Distribution of size 100 with lower limit 4 and upper limit 8
- sb.distplot(random.uniform(size=100, low=4, high=8),hist=False)
- #plotting the graph
- mpl.show()