Poisson Distribution in Python
Submitted by moazkhan on Sunday, June 28, 2020 - 08:59.
In this tutorial you will learn:
- What is a Poisson Distribution?
- Poisson Distribution Implementation in python
- Visualization of Poisson Distribution
Poisson Distribution
The Poisson distribution is the discrete probability distribution of the number of events occurring in a given time period, the average number of times the event occurs over that time period is known. The number of experiments in Poisson Distribution are always fixed. For example, if an individual is responsible for keeping a count of number of mails arriving in the post office, and he observes that he receives an average number of 4 mails in a day. The mails arriving in the post office are arriving independently of the time of arrival of the last mail, hence it will be correct to assume that the pieces of mail obey poisson distribution. In this case, the poisson distribution will let us find the probability of receiving 5 mails.Poisson Distribution in Python
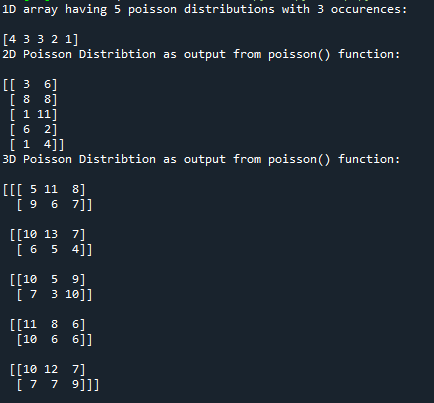
Poisson distribution in python is implemented using poisson() function. The poisson() function takes in two mandatory parameters. Frist parameter “size” is the size of the output of multi dimensional array while the second parameter “lam” is the rate of occurrence of a specific event. In this example we will generate an 1D array(1,5) of distribution having the occurrence 3, if we relate this example with the example explained above, here we are considering that the mails being received in a day are 3, and are finding 5 poisson distributions for it.- #importing the random module
- from numpy import random
- #applying the poisson function with 3 occurrences and 5 distributions
- res = random.poisson(lam=3, size=5)
- #printing the result
- print('1D array having 5 poisson distributions with 3 occurences:\n')
- print(res)
- #importing the random module
- from numpy import random
- #here we are using poisson function to generate poisson distribution of size 5 x 2 with occurrence 5
- res = random.poisson(lam=5, size=(5,2))
- print('2D Poisson Distribution as output from poisson() function:\n')
- #printing the result
- print(res)
- #importing the random module
- from numpy import random
- #here we are using poisson function to generate poisson distribution of size 5 x 2 x 3 with occurrence 8
- res = random.poisson(lam=8, size=(5,2,3))
- print('3D Poisson Distribution as output from poisson() function:\n')
- #printing the result
- print(res)
Visualization of Poisson Distribution
In this example, for our better understanding of poisson distribution itself and the syntax, we will plot poisson distribution on a graph. Here we will again use distplot() function for graph plot. The occurrences in an interval will be 4 while the number of distributions will be 100.- #importing all the required modules and packages
- from numpy import random
- import matplotlib.pyplot as mpl
- import seaborn as sb
- #here we are using Poisson function to generate Poisson distribution of size 100
- sb.distplot(random.poisson(size=100, lam = 4),kde=False)
- #plotting the graph
- mpl.show()