NumPy Data Distribution
Submitted by moazkhan on Tuesday, June 23, 2020 - 14:07.
In this tutorial you will learn:
- What is data distribution?
- How data distribution is carried out in Numpy?
Data Distribution
A data distribution is a listing that shows all the possible values within the given intervals or data limits. It also tells the number of occurrences of each element. Usually the distributed data is ordered from lowest to highest or alphabetically and chart or graphs are used to represent it. The probability for occurrence of any element can be calculated by applying the mathematical function on the sample space, this function is called probability density function. This function describes the probability of each element in the array and random numbers following the probability density function are called random distribution numbers.NumPy Data Distribution
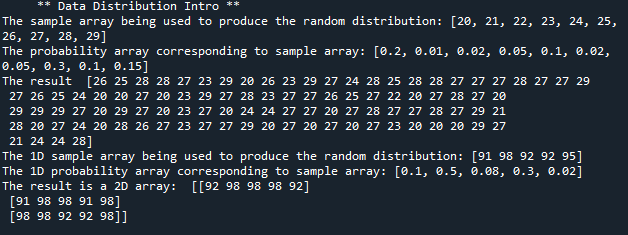
Random module in NumPy library provides a function choice(), this function enables us to generate the elements based on a specific probability passed on as 1D array, hence there are two 1D arrays that will be passed on to the choice() function. For generating an array of a specific size and probabilities, we will have to pass choice() function three parameters. First argument will be a 1D array that will contain the elements, second parameter will be the 1D array of probabilities corresponding to each element of the 1D array being passed as first parameter while third parameter is the size of array which will be the output of the function. To ensure correct results, we have to check that the sum of probability array equals to 1 otherwise the compiler will generate an error. In this example, we will pass a 1D array having ten elements, a corresponding probability array and size of array being generated as output. The ten elements will having following probabilities. 1. 20 (0.2) 2. 21 (0.01) 3. 22 (0.02) 4. 23 (0.05) 5. 24 (0.1) 6. 25 (0.02) 7. 26 (0.05) 8. 27 (0.3) 9. 28 (0.1) 10. 29 (0.15)- from numpy import random as r
- #here we are declaring a 1D array having elements (values)
- sample_arr = [20,21,22,23,24,25,26,27,28,29]
- print('The sample array being used to produce the random distribution:', sample_arr)
- #here we are declaring a 1D array corresponding to each value in the element array
- prob_arr = [0.2,0.01,0.02,0.05,0.1,0.02,0.05,0.3,0.1,0.15]
- print('The probability array corresponding to sample array:', prob_arr)
- #passing arrays as arguments to the choice function
- res = r.choice(sample_arr, p=prob_arr, size=(100))
- print('The result ',res)
- from numpy import random as r
- #here we are auto declaring a 1D array having elements (values)
- sample_arr = r.randint(90,100,size=(5))
- print('The 1D sample array being used to produce the random distribution:', sample_arr)
- #here we are declaring a 1D array corresponding to each value in the element array
- prob_arr = [0.1,0.5,0.08,0.3,0.02]
- print('The 1D probability array corresponding to sample array:', prob_arr)
- #passing arrays as parameters to the choice function
- res = r.choice(sample_arr, p=prob_arr, size=(3,5))
- print('The result is a 2D array: ',res)