Python Seaborn
Submitted by moazkhan on Thursday, June 25, 2020 - 11:15.
In this tutorial you will learn:
- What is a seaborn library?
- Seaborn installation
- How we can use it to plot graphs?
Seaborn library
Seaborn is a library using which we can make statistical graphs in Python. Seaborn is based on library “matplotlib”, it is utilized for creating static, animated and interactive visualization but since seaborn is more latest, interactive, flexible and easier to code with, hence it is more use friendly and preferred among the programmers. Using seaborn we can visualize various kind of distributions which we will be learning in upcoming tutorials.Seaborn Installation
As for installation of NumPy it was recommended to use anaconda software, so here we are assuming that you are using anaconda and we will carry out installation of seaborn in anaconda. Open anaconda, click on IPython console and type pip install seaborn After waiting for few minutes, a message will come up requesting you to restart the kernel, press Ctrl+. and you will find a confirmation dialog, press yes. The seaborn has been successfully installed in acaconda.Plotting Graphs
Function displot() is one of the primary function of the seaborn module, and it takes a 1D array as a parameter and plots a curve corresponding to distribution of points in array. In this example in the first line we will import matplotlib package, in the second line we are importing seaborn package and use the seaborn package’s function displot() to plot curves depending upon the input array values. The displot() function can take in total 16 parameters, but here we will be discussing only those arguments that are necessary to get basic knowledge and syntax of this function. In results you can observe that there is a bell shaped curve having a light blue colored rectangle inside it. This rectangle represents the histogram.- #importing matplotlib and it will be referred to as mpl
- import matplotlib.pyplot as mpl
- #importing seaborn package and it will be referred as sb
- import seaborn as sb
- #calling the distplot() function of seaborn package.
- sb.distplot([1.2,2.4,3.6,4.8,6,7.2])
- #displaying the result
- mpl.show()
- #importing matplotlib and it will be referred to as mpl
- import matplotlib.pyplot as mpl
- #importing seaborn package and it will be referred as sb
- import seaborn as sb
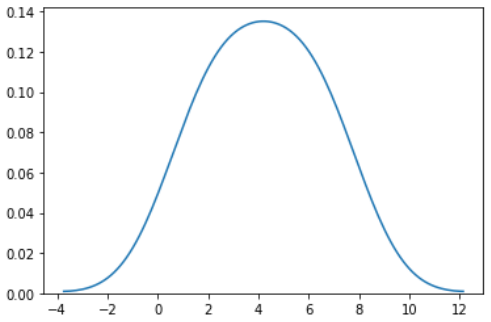
- #calling the distplot() function of seaborn package.
- sb.distplot([1.2,2.4,3.6,4.8,6,7.2],hist=False)
- #displaying the result
- mpl.show()