This tutorial is about how to
create a Pie Graph using PHP/MySQLi. In here, you will be able to learn the simple way of creating a pie graph by fetching the data inside the database. This pie graph is usually use in
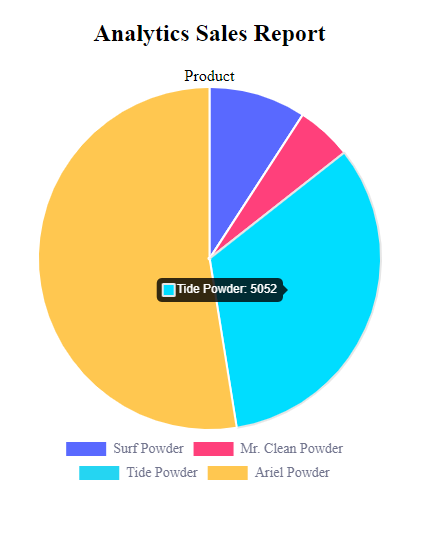
Analytics sales report to determine what kind of products have the most number of purchase. Whoever has the biggest slice in the pie graph it is the product that has the most number purchased by the customers. Follow the instructions below to see how it works.
Creating Database
Create a database named “
salesdb”.
Execute the following query for adding table and inserting data in the table.
--
-- Dumping data for table `tblsales`
--
(1, 'Surf Powder', 1400),
(2, 'Mr. Clean Powder', 800),
(3, 'Tide Powder', 5052),
(4, 'Ariel Powder', 8030);
--
-- Indexes for dumped tables
--
--
-- Indexes for table `tblsales`
--
--
-- AUTO_INCREMENT for dumped tables
--
--
-- AUTO_INCREMENT for table `tblsales`
--
Creating HTML and PHP Script
Step 1
Create and landing page and name it “
index.php”
Step 2
Do the following codes for the index page.
<!DOCTYPE html>
<html lang="en">
<head>
<meta http-equiv="Content-Type" content="text/html; charset=utf-8" />
<meta name="viewport" content="width=device-width, initial-scale=1.0">
<title>Graph</title>
</head>
<body>
<div style="width:30%;hieght:20%;text-align:center">
<h2 class="page-header" >Analytics Sales Report </h2>
<div>Product </div>
<canvas id="chartjs_pie"></canvas>
</div>
</body>
</html>
Step 3
Add the following extension to access
Chart.js Libraries.
<script src="//code.jquery.com/jquery-1.9.1.js"></script>
<script src="//cdnjs.cloudflare.com/ajax/libs/Chart.js/2.4.0/Chart.min.js"></script>
Step 4
Create a php script for fetching the data in the database.
<?php
if (!$con) {
# code...
echo "Problem in database connection! Contact administrator!" . mysqli_error(); }else{
$sql ="SELECT * FROM tblsales";
$chart_data="";
$productname[] = $row['Product'] ;
$sales[] = $row['TotalSales'];
}
}
?>
Step 5
Create a JavaScript script for displaying a graph.
<script type="text/javascript">
var ctx = document.getElementById("chartjs_pie").getContext('2d');
var myChart = new Chart(ctx, {
type: 'pie',
data: {
labels:<?php echo json_encode($productname); ?>,
datasets: [{
backgroundColor: [
"#5969ff",
"#ff407b",
"#25d5f2",
"#ffc750",
"#2ec551",
"#7040fa",
"#ff004e"
],
data:<?php echo json_encode($sales); ?>,
}]
},
options: {
legend: {
display: true,
position: 'bottom',
labels: {
fontColor: '#71748d',
fontFamily: 'Circular Std Book',
fontSize: 14,
}
},
}
});
</script>
<?php
if (!$con) {
# code...
echo "Problem in database connection! Contact administrator!" . mysqli_error(); }else{
$sql ="SELECT * FROM tblsales";
$chart_data="";
$productname[] = $row['Product'] ;
$sales[] = $row['TotalSales'];
}
}
?>
<!DOCTYPE html>
<html lang="en">
<head>
<meta http-equiv="Content-Type" content="text/html; charset=utf-8" />
<meta name="viewport" content="width=device-width, initial-scale=1.0">
<title>Graph</title>
</head>
<body>
<div style="width:30%;hieght:20%;text-align:center">
<h2 class="page-header" >Analytics Reports </h2>
<div>Product </div>
<canvas id="chartjs_pie"></canvas>
</div>
</body>
<script src="//code.jquery.com/jquery-1.9.1.js"></script>
<script src="//cdnjs.cloudflare.com/ajax/libs/Chart.js/2.4.0/Chart.min.js"></script>
<script type="text/javascript">
var ctx = document.getElementById("chartjs_pie").getContext('2d');
var myChart = new Chart(ctx, {
type: 'pie',
data: {
datasets: [{
backgroundColor: [
"#5969ff",
"#ff407b",
"#25d5f2",
"#ffc750",
"#2ec551",
"#7040fa",
"#ff004e"
],
}]
},
options: {
legend: {
display: true,
position: 'bottom',
labels: {
fontColor: '#71748d',
fontFamily: 'Circular Std Book',
fontSize: 14,
}
},
}
});
</script>
</html>
For any questions about this article. You can contact me @
Email –
[email protected]
Mobile No. – 09305235027 – TNT
Or feel free to comment below.