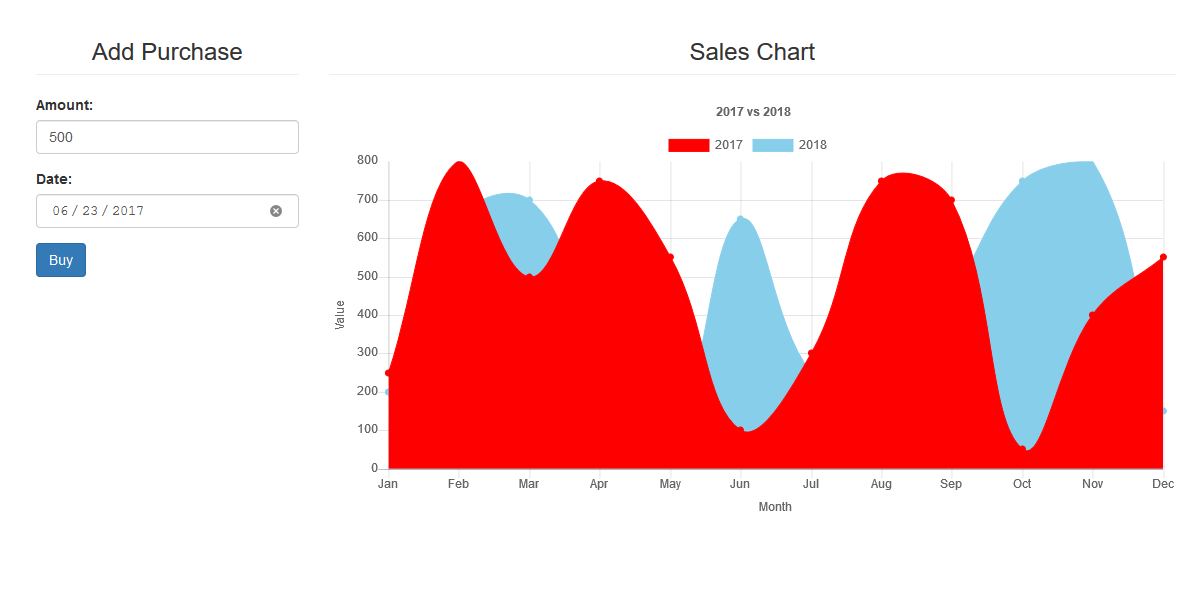
Area Chart using ChartJS, AngularJS and PHP/MySQLi
Submitted by nurhodelta_17 on Thursday, January 18, 2018 - 20:57.
Getting Started
I've used CDN for Bootstrap, Angular JS and Chart JS so you need internet connection for them to work.Creating our Database
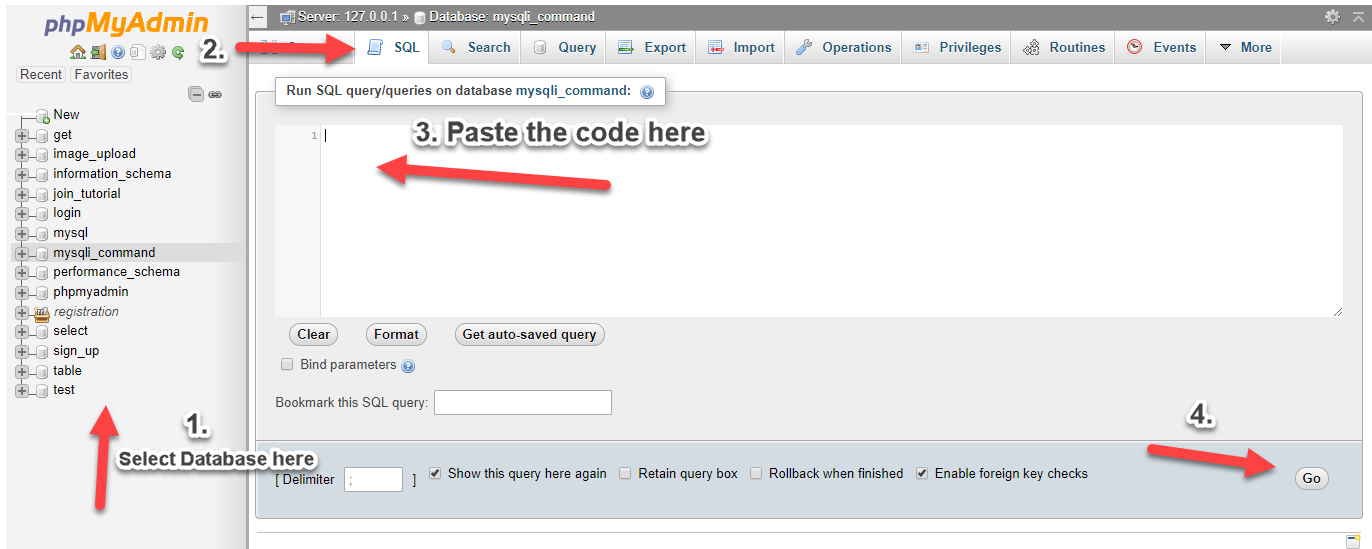
First, we're gonna create our MySQL Database where we get our data. 1. Open phpMyAdmin. 2. Click databases, create a database and name it as angular. 3. After creating a database, click the SQL and paste the below codes. See image below for detailed instruction.- (17, 50, '2018-01-01 16:00:00'),
- (18, 600, '2018-02-01 16:00:00'),
- (19, 50, '2018-02-04 16:00:00'),
- (20, 700, '2018-03-02 16:00:00'),
- (21, 350, '2018-04-03 16:00:00'),
- (22, 100, '2018-05-04 16:00:00'),
- (23, 650, '2018-06-05 16:00:00'),
- (24, 250, '2018-07-06 16:00:00'),
- (25, 200, '2018-08-07 16:00:00'),
- (26, 450, '2018-09-08 16:00:00'),
- (27, 750, '2018-10-09 16:00:00'),
- (28, 800, '2018-11-10 16:00:00'),
- (29, 150, '2018-12-11 16:00:00'),
- (30, 50, '2018-01-06 16:00:00'),
- (31, 50, '2018-01-16 16:00:00'),
- (32, 40, '2018-01-01 16:00:00'),
- (33, 10, '2018-01-21 16:00:00'),
- (34, 250, '2017-01-04 16:00:00'),
- (35, 800, '2017-02-01 16:00:00'),
- (36, 500, '2017-03-02 16:00:00'),
- (37, 750, '2017-04-03 16:00:00'),
- (38, 550, '2017-05-04 16:00:00'),
- (39, 100, '2017-06-05 16:00:00'),
- (40, 300, '2017-07-06 16:00:00'),
- (41, 750, '2017-08-07 16:00:00'),
- (42, 700, '2017-09-08 16:00:00'),
- (43, 50, '2017-10-09 16:00:00'),
- (44, 400, '2017-11-10 16:00:00'),
- (45, 550, '2017-12-11 16:00:00');
index.html
This is our index which contains our add form to update our chart and the chart itself.- <!DOCTYPE html>
- <html ng-app="app">
- <head>
- <meta charset="utf-8">
- <link href="https://maxcdn.bootstrapcdn.com/bootstrap/3.3.7/css/bootstrap.min.css" rel="stylesheet">
- <style type="text/css">
- canvas{
- margin:auto;
- }
- .alert{
- margin-top:20px;
- }
- </style>
- </head>
- <body ng-controller="myCtrl">
- <div class="container">
- <div class="row">
- <div class="col-sm-3" ng-init="fetchfruit()">
- <div class="form-group">
- <input type="text" class="form-control" ng-model="buy.amount">
- </div>
- <div class="form-group">
- <input type="date" class="form-control" ng-model="buy.date">
- </div>
- <div class="alert alert-success text-center" ng-show="success">
- {{ message }}
- </div>
- <div class="alert alert-danger text-center" ng-show="error">
- {{ message }}
- </div>
- </div>
- <div class="col-sm-9" ng-init="fetchsales()">
- <canvas id="dvCanvas" height="150" width="300"></canvas>
- </div>
- </div>
- </div>
- </body>
- </html>
app.js
This contains our angular js scripts.- var app = angular.module('app', []);
- app.controller('myCtrl', function ($scope, $http) {
- $scope.error = false;
- $scope.success = false;
- $scope.purchase = function(){
- $http.post('purchase.php', $scope.buy)
- .success(function(data){
- if(data.error){
- $scope.error = true;
- $scope.success = false;
- $scope.message = data.message;
- }
- else{
- $scope.success = true;
- $scope.error = false;
- $scope.message = data.message;
- $scope.fetchsales();
- $scope.buy = '';
- }
- });
- }
- //this fetches the data for our table
- $scope.fetchsales = function(){
- $http.get('fetchsales.php').success(function(data){
- var ctx = document.getElementById("dvCanvas").getContext('2d');
- var myChart = new Chart(ctx, {
- type: 'line',
- data: {
- labels: ["Jan", "Feb", "Mar", "Apr", "May", "Jun", "Jul", "Aug", "Sep", "Oct", "Nov", "Dec"],
- datasets: [
- {
- label: '2017',
- backgroundColor: 'red',
- borderColor: 'red',
- data: data.prev,
- borderWidth: 1,
- fill: true
- },
- {
- label: '2018',
- backgroundColor: 'skyblue',
- borderColor: 'skyblue',
- data: data.year,
- borderWidth: 1,
- fill: true
- }
- ]
- },
- options: {
- responsive: true,
- title:{
- display:true,
- text:'2017 vs 2018'
- },
- tooltips: {
- mode: 'index',
- intersect: false,
- },
- hover: {
- mode: 'nearest',
- intersect: true
- },
- scales: {
- xAxes: [{
- display: true,
- scaleLabel: {
- display: true,
- labelString: 'Month'
- }
- }],
- yAxes: [{
- display: true,
- scaleLabel: {
- display: true,
- labelString: 'Value'
- },
- ticks: {
- beginAtZero:true
- }
- }]
- }
- }
- });
- });
- }
- $scope.clear = function(){
- $scope.error = false;
- $scope.success = false;
- }
- });
fetchsales.php
This is our PHP api that fetches data from our MySQL Database.- <?php
- $conn = new mysqli("localhost", "root", "", "angular");
- //set timezone
- //date_default_timezone_set('Asia/Manila');
- $prev = $year - 1;
- for ($month = 1; $month <= 12; $month ++){
- $sql="SELECT sum(amount) AS total FROM sales WHERE month(sale_date)='$month' AND year(sale_date)='$year'";
- $query=$conn->query($sql);
- $row=$query->fetch_array();
- $out['year'][]=$row['total'];
- }
- for ($month = 1; $month <= 12; $month ++){
- $sql="SELECT sum(amount) AS total FROM sales WHERE month(sale_date)='$month' AND year(sale_date)='$prev'";
- $pquery=$conn->query($sql);
- $prow=$pquery->fetch_array();
- $out['prev'][]=$prow['total'];
- }
- ?>
purchase.php
Lastly, this is our PHP api/code that adds data into our MySQL Table.- <?php
- $conn = new mysqli("localhost", "root", "", "angular");
- $amount = $data->amount;
- $sql = "INSERT INTO sales (amount, sale_date) VALUES ('$amount', '$date')";
- $query = $conn->query($sql);
- if($query){
- $out['message'] = "Purchase added successfully";
- }
- else{
- $out['error'] = true;
- $out['message'] = "Cannot add purchase";
- }
- ?>