How to Create a Bar Graph in Python
In this tutorial, we will program 'How to Create a Bar Graph in Python'. This time, we will learn how to create a simple bar graph. This Python program uses a library called matplotlib to display a bar graph with a user interface. I will provide a sample program to demonstrate the actual coding of this tutorial.
This tutorial will demonstrate the proper way of creating a game using a specific library. The program I will show you the proper way of displaying a bar graph. I will do my best to provide you with with a simple code that enable you to display a result in bar graph format. So, let's start with the coding.
Getting Started:
First you will have to download & install the Python IDLE's, here's the link for the Integrated Development And Learning Environment for Python https://www.python.org/downloads/.
Creating Main Function
This is the main function of the application. The following code will display a simple GUI in terminal console that will display program. To do this, simply copy and paste these blocks of code into the IDLE text editor.- import matplotlib.pyplot as plt
- left = [1, 2, 3, 4, 5]
- height = [333894467, 125897345, 1412869385, 1412678232, 142684345]
- tick_label = ['USA', 'Japan', 'China', 'India', 'Russia']
- plt.bar(left, height, tick_label = tick_label,
- width = 0.8, color = ['red', 'green', 'blue', 'yellow', 'orange'])
- plt.xlabel('Country')
- plt.ylabel('Total Population')
- plt.title('Bar Chart')
- plt.show()
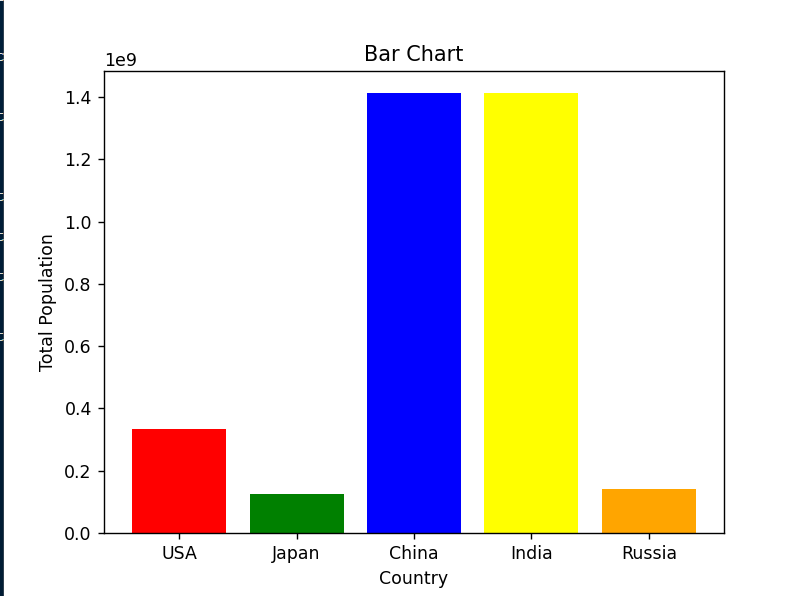
In the code provide we use Matplotlib library to create a bar chart showing the total population of five countries. It defines the data for the countries (population) and their corresponding names.
Then, it plots the bar chart using the plt.bar() function, specifying the left positions, heights, tick labels, widths, and colors for the bars. Finally, it adds labels for the x and y axes and sets the title of the chart before displaying it using plt.show().
Output:

The How to Create a Bar Graph in Python source code that I provide can be download below. Please kindly click the download button.
There you have it we successfully created How to Create a Bar Graph in Python. I hope that this simple tutorial help you to what you are looking for. For more updates and tutorials just kindly visit this site. Enjoy Coding!
More Tutorials for Python Language

