How to Create a Bar Graph using PHP/MySQLi and ChartJS
In this tutorial, I will teach you how to create a Bar Graph using PHP/MySQLi. Bar graphs are used to compare products and track the changes of product sales over time. It is determined by the category of data that can be viewed in rectangular bars with heights equivalent to the values presented. You can also check my previous tutorial which is How to Create a Pie Graph.
Let’s BeginFirst, download and install the latest version of XAMPP. Then open the XAMPP's Control Panel and start "Apache" and "MySQL".
Creating Database
Create a database named “salesdb”.Execute the following query for adding the table and inserting data in the table.
- --
- -- Dumping data for table `tblsales`
- --
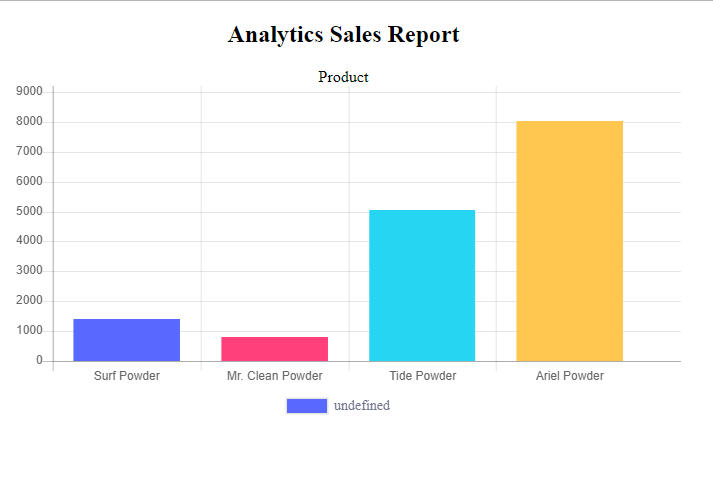
- (1, 'Surf Powder', 1400),
- (2, 'Mr. Clean Powder', 800),
- (3, 'Tide Powder', 5052),
- (4, 'Ariel Powder', 8030);
- --
- -- Indexes for dumped tables
- --
- --
- -- Indexes for table `tblsales`
- --
- --
- -- AUTO_INCREMENT for dumped tables
- --
- --
- -- AUTO_INCREMENT for table `tblsales`
- --
Creating HTML and PHP Script
Step 1
Create a landing page and name it “index.php”.
Step 2
Do the following codes for the index page.
- <!DOCTYPE html>
- <html lang="en">
- <head>
- <meta http-equiv="Content-Type" content="text/html; charset=utf-8" />
- <meta name="viewport" content="width=device-width, initial-scale=1.0">
- <title>Graph</title>
- </head>
- <body>
- <div style="width:30%;hieght:20%;text-align:center">
- <h2 class="page-header" >Analytics Reports </h2>
- <div>Product </div>
- <canvas id="chartjs_bar"></canvas>
- </div>
- </body>
- </html>
Step 3
Add the following extension to access Chart.js Libraries.
- <script src="//code.jquery.com/jquery-1.9.1.js"></script>
- <script src="//cdnjs.cloudflare.com/ajax/libs/Chart.js/2.4.0/Chart.min.js"></script>
Step 4
Create a php script for fetching the data in the database.
- <?php
- if (!$con) {
- # code...
- }else{
- $sql ="SELECT * FROM tblsales";
- $chart_data="";
- $productname[] = $row['Product'] ;
- $sales[] = $row['TotalSales'];
- }
- }
- ?>
Step 5
Create a JavaScript script for displaying a graph.
- <script type="text/javascript">
- var ctx = document.getElementById("chartjs_bar").getContext('2d');
- var myChart = new Chart(ctx, {
- type: 'bar',
- data: {
- labels:<?php echo json_encode($productname); ?>,
- datasets: [{
- backgroundColor: [
- "#5969ff",
- "#ff407b",
- "#25d5f2",
- "#ffc750",
- "#2ec551",
- "#7040fa",
- "#ff004e"
- ],
- data:<?php echo json_encode($sales); ?>,
- }]
- },
- options: {
- legend: {
- display: true,
- position: 'bottom',
- labels: {
- fontColor: '#71748d',
- fontFamily: 'Circular Std Book',
- fontSize: 14,
- }
- },
- }
- });
- </script>
Full Source Code
- <?php
- if (!$con) {
- # code...
- }else{
- $sql ="SELECT * FROM tblsales";
- $chart_data="";
- $productname[] = $row['Product'] ;
- $sales[] = $row['TotalSales'];
- }
- }
- ?>
- <!DOCTYPE html>
- <html lang="en">
- <head>
- <meta http-equiv="Content-Type" content="text/html; charset=utf-8" />
- <meta name="viewport" content="width=device-width, initial-scale=1.0">
- <title>Graph</title>
- </head>
- <body>
- <div style="width:60%;hieght:20%;text-align:center">
- <h2 class="page-header" >Analytics Reports </h2>
- <div>Product </div>
- <canvas id="chartjs_bar"></canvas>
- </div>
- </body>
- <script src="//code.jquery.com/jquery-1.9.1.js"></script>
- <script src="//cdnjs.cloudflare.com/ajax/libs/Chart.js/2.4.0/Chart.min.js"></script>
- <script type="text/javascript">
- var ctx = document.getElementById("chartjs_bar").getContext('2d');
- var myChart = new Chart(ctx, {
- type: 'bar',
- data: {
- datasets: [{
- backgroundColor: [
- "#5969ff",
- "#ff407b",
- "#25d5f2",
- "#ffc750",
- "#2ec551",
- "#7040fa",
- "#ff004e"
- ],
- }]
- },
- options: {
- legend: {
- display: true,
- position: 'bottom',
- labels: {
- fontColor: '#71748d',
- fontFamily: 'Circular Std Book',
- fontSize: 14,
- }
- },
- }
- });
- </script>
- </html>
And that's the end of our tutorial. I hope this tutorial will help you with what you are looking for.
Enjoy Coding:)For any questions about this article. You can contact me @
Email – [email protected]
Mobile No. – 09305235027 – TNT
Or feel free to comment below.