How to Create a Simple Pie Chart using Google Chart API with PHP/MySQLi
Submitted by nurhodelta_17 on Monday, March 26, 2018 - 23:53.
Creating our Database
First, we are going to create our database which contains the sample data that we are going to present using Google Chart API in the form of pie chart. I've included a .sql file in the downloadable of this tutorial which is a mysql database file. All you have to do is import the said file. If you have no idea on how to do this, please refer to my tutorial, How import .sql file to restore MySQL database. You should be able to create a database with tables named mydatabase.Creating the Presentation
Lastly, we create the page where we present the data using pie chart. Create a new file, name it as index.php and paste the codes below.- <?php
- //connection
- $conn = new mysqli('localhost', 'root', '', 'mydatabase');
- $sql = "SELECT gender, count(*) as number FROM members GROUP BY gender";
- $query = $conn->query($sql);
- ?>
- <!DOCTYPE html>
- <html>
- <head>
- <meta charset="utf-8">
- <title>How to Create a Simple Pie Chart using Google Chart API using PHP/MySQLi</title>
- <link rel="stylesheet" type="text/css" href="bootstrap/css/bootstrap.min.css">
- </head>
- <body>
- <!-- this is where we show our chart -->
- <div id="piechart" style="width: 900px; height: 500px;"></div>
- <!-- Load our Scripts -->
- <script type="text/javascript" src="https://www.gstatic.com/charts/loader.js"></script>
- <script type="text/javascript">
- google.charts.load('current', {'packages':['corechart']});
- google.charts.setOnLoadCallback(drawChart);
- function drawChart(){
- var data = google.visualization.arrayToDataTable([
- ['Gender', 'Number'],
- <?php
- while($row = $query->fetch_assoc()){
- echo "['".$row["gender"]."', ".$row["number"]."],";
- }
- ?>
- ]);
- var options = {
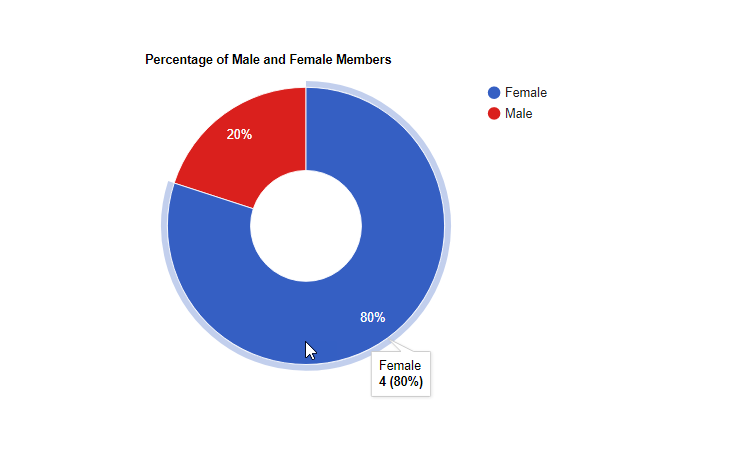
- title: 'Percentage of Male and Female Members',
- //is3D:true,
- pieHole: 0.4
- };
- var chart = new google.visualization.PieChart(document.getElementById('piechart'));
- chart.draw(data, options);
- }
- </script>
- </body>
- </html>