Real-Time Data Feeder Using HTML, CSS and JavaScript with Source Code
Welcome to the Real-Time Data Feeder, an interactive dashboard that brings dynamic data visualization to life. This modern web application transforms streaming information into compelling visual stories through live-updating charts and intuitive controls. Whether you’re tracking financial markets, monitoring sensor networks, or analyzing web traffic patterns, the platform delivers instant insights with professional-grade visualizations that respond seamlessly to changing data.
Built with HTML, CSS, and JavaScript, this application highlights the power of modern web technologies in creating responsive, user-friendly data experiences. The interface includes multiple chart types, customizable data sources, and adaptive themes designed for comfort and clarity. With seamless updates, export capabilities, and a mobile-responsive layout, the Real-Time Data Feeder provides both immediate insights and historical context for comprehensive analysis.
You may also check this simple HTML, CSS and JavaScript project:
Key Features:
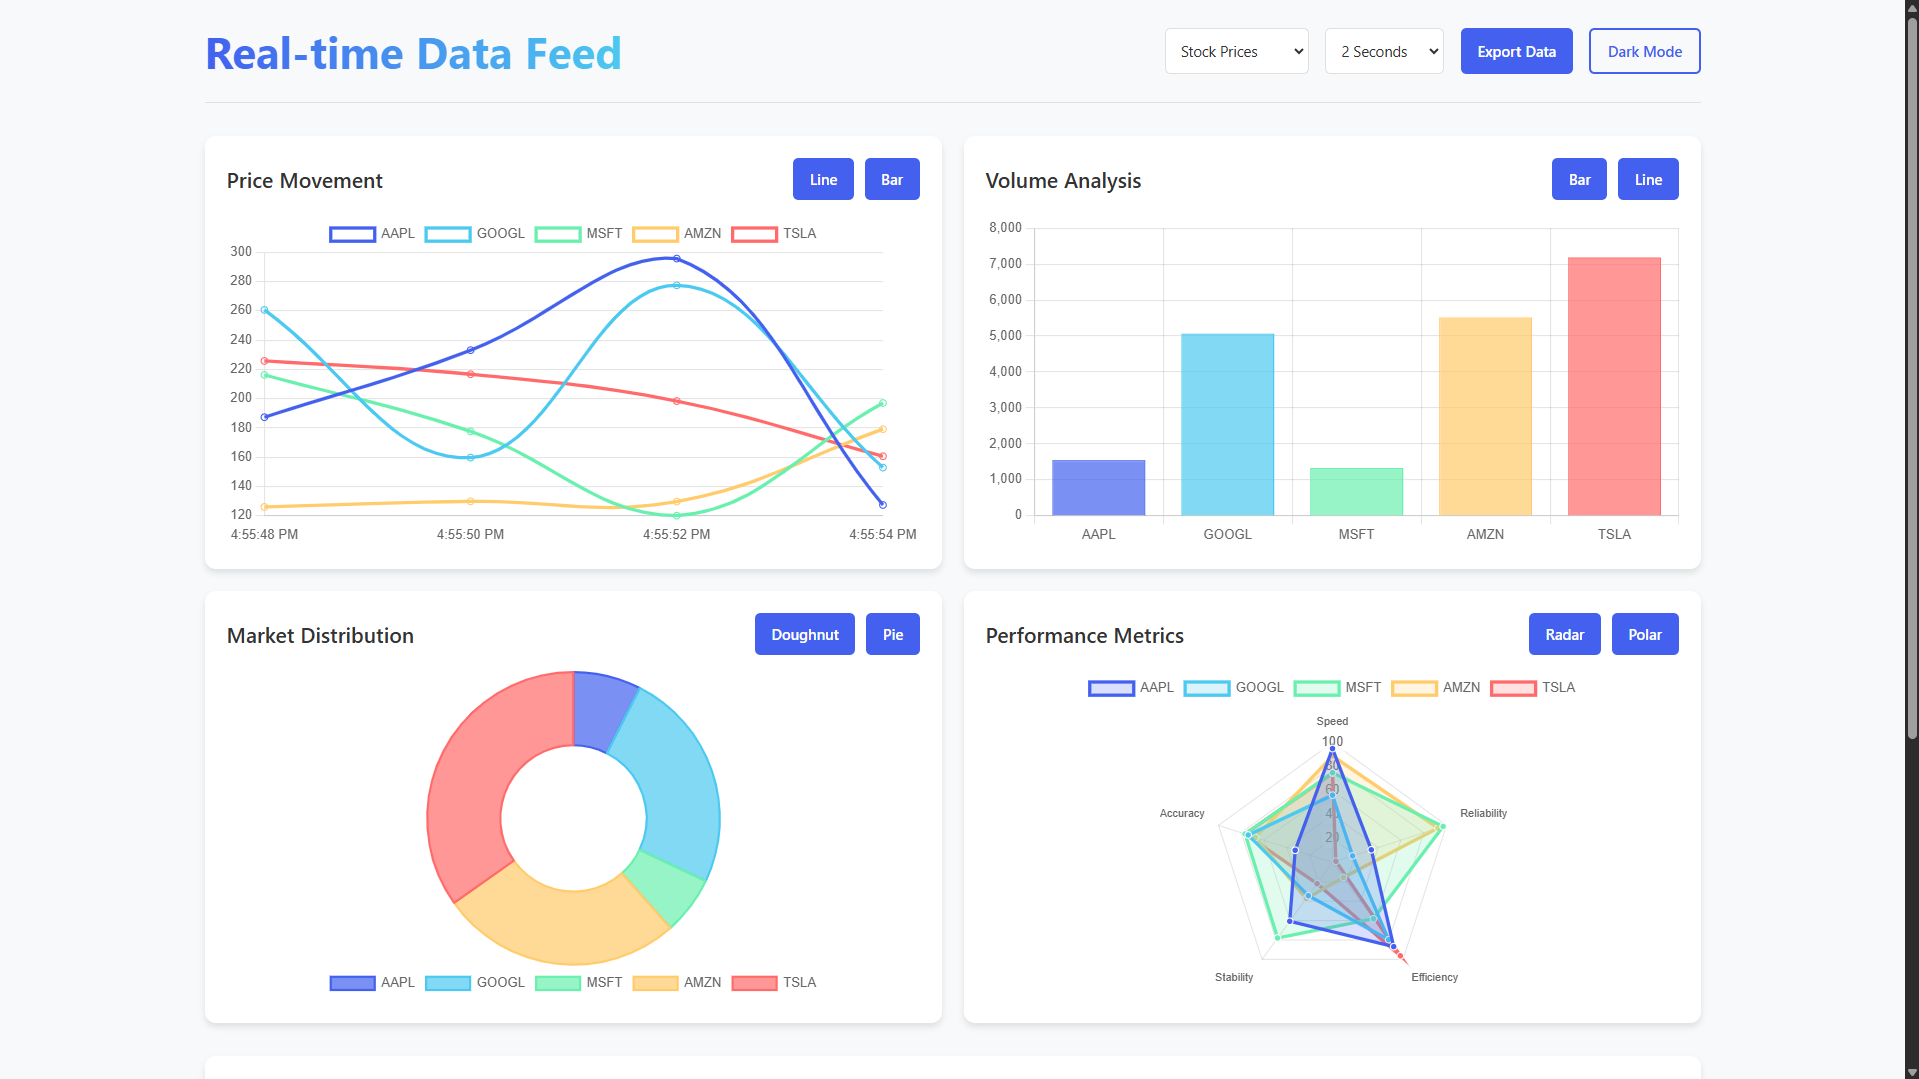
Multiple real-time chart visualizations: line, bar, area, doughnut, pie, radar, and polar
Configurable data sources simulating stock prices, cryptocurrency values, sensor data, and web traffic metrics
Adjustable update intervals (1–10 seconds) to control data refresh rates
Interactive chart type switching for each visualization panel
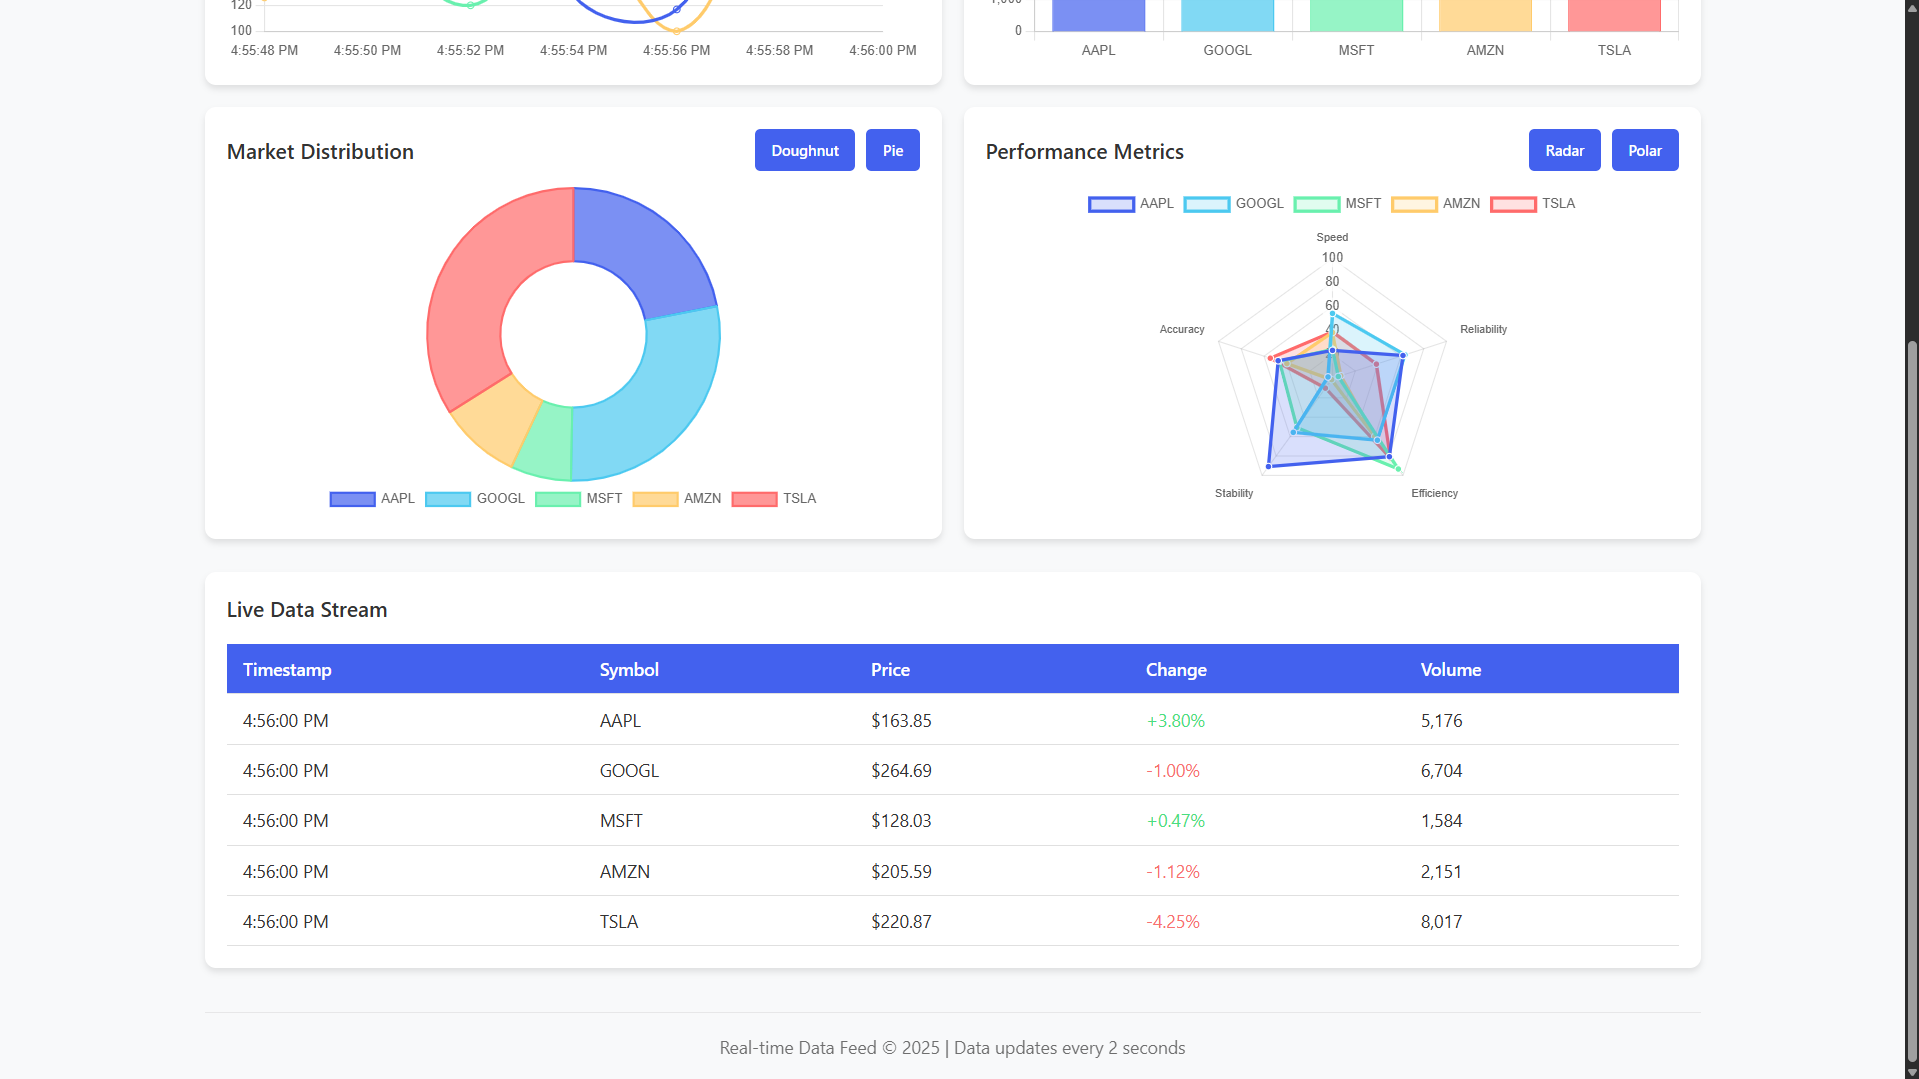
Comprehensive data table with timestamped values and color-coded changes (green for positive, red for negative)
Dark and light mode themes for comfortable viewing
Data export to CSV format for external analysis
Fully responsive design optimized for desktop, tablet, and mobile devices
Smooth animations and transitions for an enhanced user experience
Modern card-based UI with hover effects and professional styling
Technologies Used:
HTML5 for semantic structure and framework
CSS3 with custom properties for theming and responsive design
JavaScript (ES6+) for logic and real-time functionality
Chart.js library for dynamic visualizations
Flexbox and CSS Grid for modern layouts
Custom color palette with CSS variables for consistent theming
How to Use:
Select a data source from the dropdown menu (stocks, cryptocurrency, sensors, or web traffic).
Adjust the update frequency using the interval selector.
Switch chart types with the buttons above each visualization.
Monitor real-time changes in the data table below the charts.
Toggle between dark and light modes for your preferred viewing environment.
Export data to CSV for further external analysis.
Observe color-coded values in the table (green = positive, red = negative).
The system maintains the last 20 data points for historical context.
All visualizations update simultaneously as new data arrives.
The interface automatically adapts to different screen sizes and devices.
Sample Screenshots of the Project
Landing Page
Other Graph
How to Run?
- Download the provided source code zip file.
- Extract the downloaded zip file.
- Open the html file and you are now ready to go!
Video Demonstration for Installation/Setup:
Conclusion:
In conclusion, the Real-Time Data Feeder demonstrates how modern web technologies transform raw data into actionable insights through elegant visualizations and intuitive interactions. It serves as a powerful example of responsive web design in action, providing users with a sophisticated yet accessible tool for monitoring dynamic information across various domains. By combining real-time functionality with thoughtful design elements, the platform delivers both immediate analytical value and a solid foundation for future customization.
That's it! I hope this "Real-Time Data Feeder Using HTML, CSS and JavaScript" will assist you on your programming journey, providing value to your current and upcoming projects.
For additional tutorials and free source codes, explore our website.
Enjoy Coding :>>
Note: Due to the size or complexity of this submission, the author has submitted it as a .zip file to shorten your download time. After downloading it, you will need a program like Winzip to decompress it.
Virus note: All files are scanned once-a-day by SourceCodester.com for viruses, but new viruses come out every day, so no prevention program can catch 100% of them.
FOR YOUR OWN SAFETY, PLEASE:
1. Re-scan downloaded files using your personal virus checker before using it.
2. NEVER, EVER run compiled files (.exe's, .ocx's, .dll's etc.)--only run source code.