Introduction
In this tutorial, you will learn how to Create a Bar, Line, and Pie Chart using ChartJS Library with dynamic data values. The tutorial aims to provide a reference or guide to students or new programmers on how to use and implement Charts in web applications. Here, snippets of creating the charts and generating dynamic values are provided and a sample web app source code zip file is also provided and is free to download.
What is ChartJS
ChartJS is a community-maintained project. It is a JavaScript Plugin or Library that helps developers to generate different kinds of charts for their web projects. The said plugin can generate 8 different types of charts that can provide end-users with a visual view of the data values. Visit ChartJS Official Website to know more.
How to Create a Bar, Line, and Pie Chart?
Developers often use charts to provide the end-users with a better visual representation of data. In some instances, developers do need to display the charts with dynamic data values that are commonly stored in a database or generated from a certain logic that we created to meet our requirements. ChartJS provides consideration for the developers to easily manipulate the datasets in the generated Chart. By that, developers can simply use the provided API or script for this to update the chart even without needing to reload the page.
Example Snippets
Here are some examples of creating a Bar, Line, or Pie chart with dynamic data values using the ChartJS plugin.
The snippets below use the following function constant and function for the chart colors and randomly generate a data value. I used the Bootstrap v5 framework for the interface design on the snippets.
const colors = ['#AAC4FF', '#CDF0EA', "#6E85B7", '#68A7AD'];
const labels = ["Data 101", "Data 102", "Data 103", "Data 104"]
function rand_num(){
return Math.floor( Math.random() * (9999 - 1) + 1 );
}
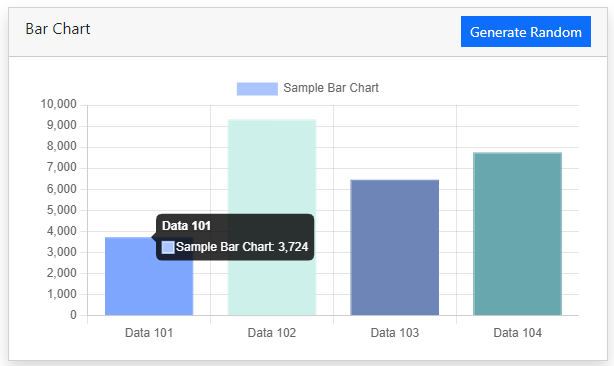
Creating a Bar Chart
Here are the snippets to generate a Bar Chart in a web application using ChartJS.
HTML
<div class="card shadow rounded-0"> <div class="card-header rounded-0"> <div class="d-flex justify-content-between"> <div class="card-title flex-shrink-1 flex-grow-1">Bar Chart
</div> <button class="btn btn-primary btn-sm rounded-0" id="generate_bar">Generate Random
</button> <div class="container-fluid"> <canvas id="bar_chart"></canvas>
JavaScript
/**
* Bar Chart
*/
const default_value = [rand_num(), rand_num(), rand_num(), rand_num()]
const default_value2 = [rand_num(), rand_num(), rand_num(), rand_num()]
const barChart = new Chart(document.getElementById('bar_chart').getContext('2d'), {
type: 'bar',
data:{
labels:labels,
datasets: [{
label: "Sample Bar Chart",
data: default_value,
backgroundColor: colors,
borderColor: colors,
borderWidth: 1
}]
},
options:{
scales: {
y: {
beginAtZero: true
}
}
}
})
$('#generate_bar').click(function(){
var new_values = [rand_num(), rand_num(), rand_num(), rand_num()]
/**
* You can get your dynamic values from other page or file
* i.e
* $.ajax({
* url:'dynamic_data.php?id=1',
* dataType:'JSON',
* success: function(response){
* values = Object.values(response)
* }
* })
*/
/**
* After getting the new values, Update the dataset's data
*/
barChart.data.datasets[0].data = new_values
/**
* Then Update the Chart
*/
barChart.update()
})
Result Snapshot
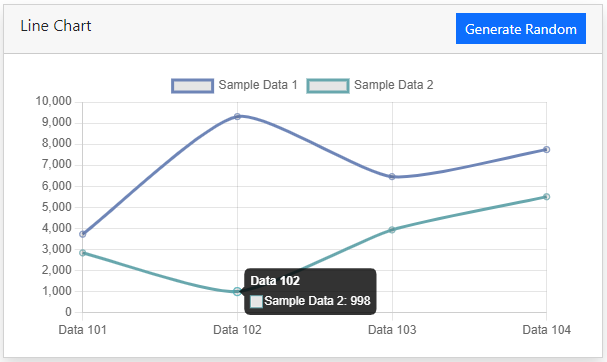
Creating a Line Chart
Here are the snippets to generate a Line Chart in a web application using ChartJS.
HTML
<div class="card shadow rounded-0"> <div class="card-header rounded-0"> <div class="d-flex justify-content-between"> <div class="card-title flex-shrink-1 flex-grow-1">Line Chart
</div> <button class="btn btn-primary btn-sm rounded-0" id="generate_line">Generate Random
</button> <div class="container-fluid"> <canvas id="line_chart"></canvas>
JavaScript
/**
* Line Chart
*/
const lineChart = new Chart(document.getElementById('line_chart').getContext('2d'), {
type: 'line',
data:{
labels:labels,
datasets: [{
label: "Sample Data 1",
data: default_value,
borderColor: colors[Math.floor( Math.random() * (3 - 0) + 1 )],
fill:false,
tension: 0.2
},
{
label: "Sample Data 2",
data: default_value2,
borderColor: colors[Math.floor( Math.random() * (3 - 0) + 1 )],
fill:false,
tension: 0.2
}
]
},
options:{
scales: {
y: {
beginAtZero: true
}
}
}
})
$('#generate_line').click(function(){
var new_values = [rand_num(), rand_num(), rand_num(), rand_num()]
var new_values2 = [rand_num(), rand_num(), rand_num(), rand_num()]
/**
* You can get your dynamic values from other page or file
* i.e
* $.ajax({
* url:'dynamic_data.php?id=1',
* dataType:'JSON',
* success: function(response){
* values = Object.values(response)
* }
* })
*/
/**
* After getting the new values, Update the dataset's data
*/
lineChart.data.datasets[0].data = new_values
lineChart.data.datasets[0].borderColor = colors[Math.floor( Math.random() * (3 - 0) + 1 )]
lineChart.data.datasets[1].data = new_values2
lineChart.data.datasets[1].borderColor = colors[Math.floor( Math.random() * (3 - 0) + 1 )]
/**
* Then Update the Chart
*/
lineChart.update()
})
Result Snapshot
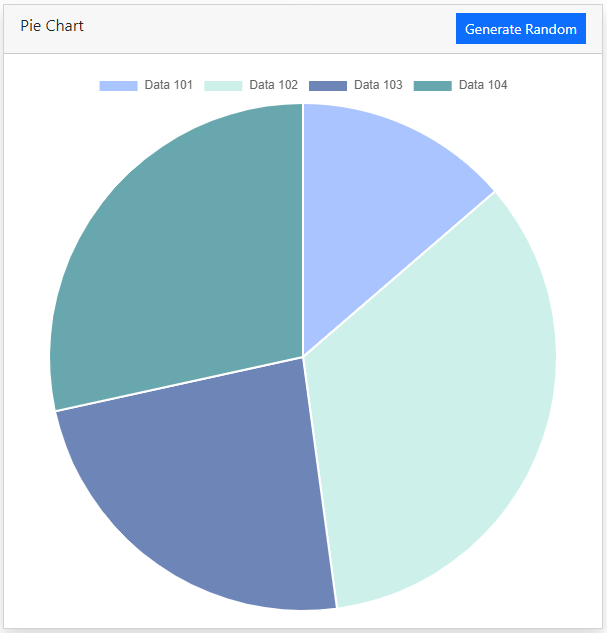
Creating a Pie Chart
Here are the snippets to generate a Pie Chart in a web application using ChartJS.
HTML
<div class="card shadow rounded-0"> <div class="card-header rounded-0"> <div class="d-flex justify-content-between"> <div class="card-title flex-shrink-1 flex-grow-1">Pie Chart
</div> <button class="btn btn-primary btn-sm rounded-0" id="generate_pie">Generate Random
</button> <div class="container-fluid"> <canvas id="pie_chart"></canvas>
JavaScript
/**
* pie Chart
*/
const pieChart = new Chart(document.getElementById('pie_chart').getContext('2d'), {
type: 'pie',
data:{
labels:labels,
datasets: [{
label: "Sample Pie Chart",
data: default_value,
backgroundColor: colors,
}
],
hoverOffset: 4
},
})
$('#generate_pie').click(function(){
var new_values = [rand_num(), rand_num(), rand_num(), rand_num()]
/**
* You can get your dynamic values from other page or file
* i.e
* $.ajax({
* url:'dynamic_data.php?id=1',
* dataType:'JSON',
* success: function(response){
* values = Object.values(response)
* }
* })
*/
/**
* After getting the new values, Update the dataset's data
*/
pieChart.data.datasets[0].data = new_values
/**
* Then Update the Chart
*/
pieChart.update()
})
Result Snapshot
On the above snippets, each chart data value can be manipulated and randomly set the data sets value by clicking the Generate Random button. Doing so, the application will automatically generate new random data value for each chart and automatically updates the displayed chart to its updated values.
Combined Charts Snapshot

That's the end of this tutorial. I hope this Dynamic Bar, Line, and Pie Chart using ChartJS Tutorial will help you with what you are looking for and that you'll find this useful for your current and future projects. I have also provided the source code zip file that combines the snippet above. Feel free to download it by clicking the download button below.
Explore more on this website for more Tutorials and Free Source Codes.
Happy Coding:)