Bar Chart Plugin with jQuery
Submitted by alpha_luna on Friday, September 23, 2016 - 09:23.
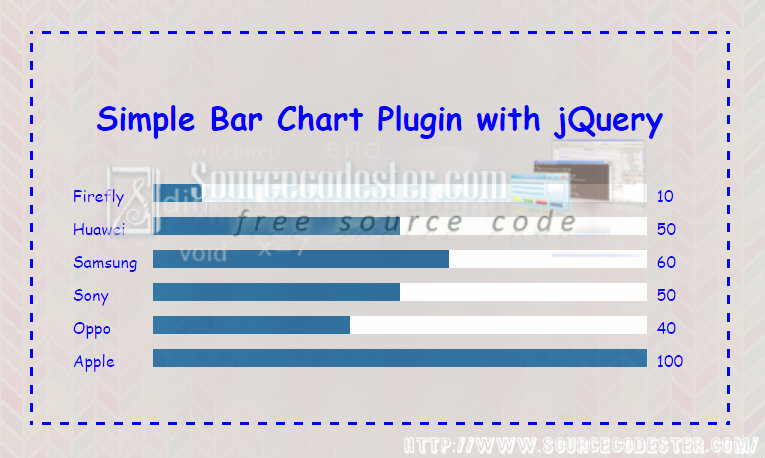
This tutorial helps you make a Bar Chart Plugin with jQuery, I made a Chart that shows the percentage of different brands of Cellphones.
I'm using jQuery and HTML/CSS to create this simple bar chart.
Hope that this tutorial will help you a lot.
You can also check the live demo of this simple tutorial, so you can get an idea and you can try this out, let's start coding.
And, kindly include this simple script to initialize the jQuery plugin.
 Hope that this simple yet useful tutorial that I created may help you to your future projects.
For the full source code, kindly click the "Download Code" button below.
How to Create it
Kindly include this file to the HEAD tag of your web page to have a simple style the Bar Chart.
You have to construct simple markup for the structure of the Bar Chart. Then, you have to specify the numeric value using "data-value". It looks like this.
- <div class="simple_Bar_Chart">
- <div class="barChart__row" data-value="10">
- </div>
- <div class="barChart__row" data-value="50">
- </div>
- <div class="barChart__row" data-value="60">
- </div>
- <div class="barChart__row" data-value="50">
- </div>
- <div class="barChart__row" data-value="40">
- </div>
- <div class="barChart__row" data-value="100">
- </div>
- </div>
- <script src="jquery-1.12.4.min.js"></script>
- <script src="jquery.easing.min.js"></script>
- <script src="jquery.barChart.js"></script>
- <script>
- jQuery('.simple_Bar_Chart').simple_Bar_Chart({easing: 'easeOutQuart'});
- </script>
Output
 Hope that this simple yet useful tutorial that I created may help you to your future projects.
For the full source code, kindly click the "Download Code" button below.

