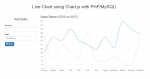
Line Chart using ChartJS, AngularJS and PHP/MySQLi
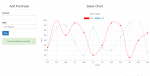
This tutorial tackles on how to create a Line Chart in Angular JS using Chart JS with PHP/MySQLi. Chart JS is a javascript library that creates charts for data presentation with the help of HTML 5 canvas. We will use PHP/MySQLi to fetch data from our database that we'll be using in our chart.
- Read more about Line Chart using ChartJS, AngularJS and PHP/MySQLi
- 1 comment
- Log in or register to post comments
- 767 views